Liberating multiple data products from a single DAS data stream

A key motivation for Indeximate is the mantra of “never delete the data”.  We’ve suffered in past careers by observing really interesting data live but not having the disk space to store it, nor the desire to handle the practicality of storing lots of disks nor the easy ability to load and process lots of disks.

A key feature of our Scattersphere is the storage of all recorded DAS data in the cloud – uploaded by our Indeximation step.  This gives us at our fingertips access to months of data – so what can we do with it?

This is where DAS gets exciting – the wide range of vibrations from near DC to infrasonic to ultrasonic is just incredible and hidden within that data is a wealth of data that is never really exploited. For example, if we are focussed on the health of the cable that we are monitoring we will profile this data for all things pertaining to integrity and/or the state of the deployment environment but ignore all the interesting data that might be in the watercolumn or the further seabed.   And in there lies a wealth of further information that could be helping us unlock a better understanding of the oceans.

A wealth of data hides in the DAS data stream

Thinking further, pulling the data to the cloud allows us to consider not just what is happening in the environment locally to the cable but potentially we can get an integrated view across multiple cables and start to build a networked picture of circumstances across both multiple distance scales as well as time scales – ultimately adding to our knowledge of global issues such as the effects of climate change – given enough time and data.

So what have we illustrated so far?   We’ve been slowly publishing a lot of phenomenological observations (take a look at our Micro Learnings web page and our blog) whilst we’ve been busy at work looking after the health of the cable.

So what aspects are practically available from a data reuse aspect?

  • Behaviour of the inter-tidal zone
  • Temperature change
  • Tidal Stream analysis (distinct from tidal analysis) / Ocean currents
  • Lunar tidal relationships
  • Wave Height information
  • Shipping Movement, speed, location, classification
  • Ocean Noise
  • Turbine vibration / piling / noise transmitted through seabed
  • Cetacean Monitoring / Marine Mammal Observations
  • Piling Noise
  • Human Terrestrial Activity on land sections – and this list just gets larger and larger – there’s no end really to what we might consider monitoring.

The growth of offshore wind is a huge opportunity – key of course is the transition to the electrical economy.  In doing so we of course need to ensure that impacts on the environment are closely monitored – the monitoring of our cables provides an opportunity to do just that.

Take a look at the image below snapped from 4C Offshore.

Power cables crossing the North Sea offer huge potential – courtesy 4C Offshore

The export cables, array cables and interconnects are not visible at this resolution but you can imagine – there’s a LOT.  What do you think of when you see this?  A net zero opportunity?  A risk to the environment?  An opportunity for energy security?  A risk to energy security?

We look at and envisage the greatest subsea monitoring network that humans have ever created.   Tens of thousands of km on the seabed – with a sensor every ten metres.   Thinking in those terms allows us to imagine how this network could be used in 10 or 20 years.   Our knowledge of the seabed and the marine environment will jump massively over the paucity of data that we have at the moment.  Both for the benefit of users and those species who live there but also just for the sake of knowledge itself.

So to the examples given – what evidence do we have?

Ocean Currents

Thermal change caused by ocean currents (31km y axis / 3.5 days x axis)

In this first image we are looking out over 3.5 days at a ~31km long stretch of cable in a rocky seabed in ~1km of water.  The red regions correspond to modest local heating and the blue regions local cooling.  Consider the green to be “ambient”.  The temperature changes occur at roughly the same time across the length of the cable (with some local direction changes) so it suggests we are sitting broadside to local current.  We are seeing warmer water flowing over in one direction followed by a period of cooling back to ambient.  This is then repeated. Regularly. 

Tidal Pressure on Cables

We also demonstrated from more predictable lunar tidal flows how we can measure diurnal variations associated with inflow and outflow of tidal regions of the coast.   These have been cleaned of temperature data and what we are looking at here is the strain on the fibre from the ebb and flow of tide!  This is the water pushing against the exposed cable causing strain – in excess of any temperature variation.

Cable tidal pressure (not temperature)
Tidal patterns on shore (head of water forcing the trace)

Human Activity

In this compelling, plaid like image we are looking at a cable on the shore, following a road heading towards the inter tidal zone and then waves coming in from shore.  They are interesting of course, but the real area of interest is the strong red signals.   Here we are looking at individual cars driving down the street which the fibre follows for about 1km.  Looking over long enough we see daily and weekly patterns corresponding to the density of human activity.   These can all be counted and profiled.

Close up view of human activity close to inter-tidal zone

Shipping Activity

In this next image we see the passage of a ship along and crossing the cable as well as wave action, here the red colouring is from the engine noise of the ship, blue again is waves.  These false colour images allow better meaning to be extracted from the data without difficulty.

Boat crossing cable amongst background noise of surface waves and engine noise

Taken further and looking over a long stretch of time and space, one of our signature images below shows the transit and crossing of a vessel over the cable – here there’s a huge wealth of information that can be extracted:  Vessel heading, cable beam pattern, engine noise, propeller noise, the acoustic noise of the ship hitting the swell (those green vertical chevrons).

Our “supernova” here is a false colour image of a ship crossing cable causing wake havoc for many km!

Vibration of nearby structures

Back in January we posted on the extraction of fundamental vibration modes from turbines that we don’t go into but pass by…   We are able to show how we could identify blade passing frequencies, the flexural mode of the tower (nodding) and gearbox / nacelle noise.   Over the long term these could be used to identify tower fatigue (especially during non-producing, feathered periods) and items such as gearbox wear.

Extracting turibine structural health information from vibration stream at a single point

Wave Height

We know that our sensors are sensitive to pressure which makes them ideal for picking up longitudinal sound waves underwater.  It also makes them exceptionally sensitive to changing water heights – i.e. swell and waves. With a small amount of ground truth data we can calibrate the response to wave height and produce an image of wave height variation with time across the whole cable as shown below.

Wave heigh variation from 10km x 30min
and similar data over much longer timescales – 3.5 days and 70km

DAS – Quantitative or Qualitative for subsea cable monitoring?

In our work we often get asked by customers about the two different types of DAS unit commonly found and which they should use. As it’s our tool of choice for extracting info on the condition of cables, we thought it was time to put together some of our thoughts on the topic.

A standard device for testing the quality of an optical fibre installation in subsea cables is an OTDR (Optical Time-Domain Reflectometer). An incoherent pulse of light is sent along a fibre, and the amplitude of the reflected light, when averaged over a number of pulses, tells us if there are bend losses, splices, connectors etc. The time delay between the launch and receive of the reflected signal tells us where the features are. If a coherent laser is used as the light source something different happens and with no time averaging early Distributed Acoustic Sensing (DAS) is born.

The coherency of the laser causes interference between light that is backscattered from different parts of the fibre, and the amplitude of the reflected light from each location is therefore very sensitive to change in the optical path length of the fibre (i.e. strain change or temperature change). The sensitivity to change is somewhat randomised in both magnitude and direction, and this led to changes in the optical architecture of DAS to enable optical phase to be tracked. An intensity only DAS is often referred to as Qualitative DAS (COTDR) and a phase and amplitude tracking DAS is similarly referred to as Quantitative DAS or Phase Coherent DAS.

Both interrogator types make measurements along the fibre giving independent outputs from sections of fibre a few metres long. These length of these sections of fibre is typically called the gauge length. Shorter gauge lengths give better spatial resolution but lower sensitivity to change.

A great source of information on the physical principles of DAS is provided in the recently updated SEAFOM MSP-02 V2.0 “DAS Parameters Definitions and Tests”.

This blog post is concerned about how measurements from these devices on the same cables provide a difference in output – when should each be used?

Qualitative DAS

These units are cheaper and easier to make but do have a high enough sensitivity. Because of these reasons they still have use in monitoring subsea cables. They are excellent devices for pinpointing specific events such as vessels or the arcing caused by a thumper during fault location. It is important to note that this detection approach comes with some major limitations. Firstly, any practically relevant low frequency information is distorted and lost, secondly there is no information on the sense/sign of the stimulus (tension/compression or heating/cooling), and thirdly a noisy environment at low frequencies will tend to scramble higher frequency signals creating harmonics that are not actually present in the signal. This signal distortion is predominantly caused by being unable to track the optical signal from cable strain larger than around 0.3 microns over each gauge. All significant low frequency signals and larger magnitude high frequency signals cause more strain than this, and result in this loss of information.
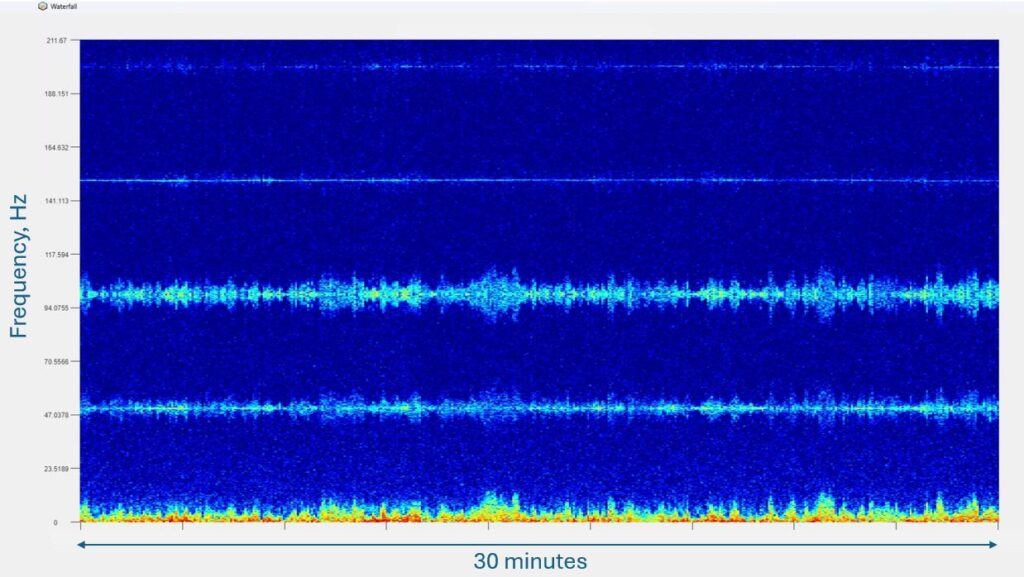
Single channel spectrogram from Qualitative DAS – under electrical load

This figure is a spectrogram of 30 minutes of data from a section of a UK export cable, 30 km from the shore. It shows the distortion of a pure 3 phase 50Hz electrical signal in a power cable by the action of waves which are occurring at a much lower frequency. This low frequency signal causes the sensitivity of the DAS to flip between positive and negative and leads to side bands in the frequency observed  hence we see distortion in the 50Hz and upper multiples of the 50Hz signal which are not present in the cable.   Care is needed on interpretation.

In qualitative systems, the maximum range is strongly correlated to the gauge length. To get distances longer than around 20 km, the length of the light pulse has to be increased to increase the amount of launched light. This reduces the spatial resolution.

Another issue that strongly affects Qualitative systems is an effect called fading. Fading occurs due to the random nature of the backscattered reflections, occasionally these can add together in such a way to give either a null response to a stimulus or no significant backscattered light. In a quiet environment, these fading effects can render specific channels useless for minutes before environmental conditions change enough to restore sensitivity. In a subsea environment this is generally less of an issue due to the noise of the environment, but it is something to be aware of.

Quantitative DAS

In a quantitative system, the optical backscatter is measured in a different way. Instead of just measuring the amplitude of the backscattered light, the optical phase of the light is measured. There are a number of techniques to achieving this, but all are more complex than simply measuring the amplitude. If the phase is measured, then absolute information about the strain or temperature change can be established Since the fibre effectively becomes a double pass interferometer, a gauge length strain of 0.5 optical wavelengths would give us around one ‘fringe’ (2Pi radians). The wavelength of the light used (typically 1550nm in vacuum)is very close to 1 micron in glass. Straining the fibre also modifies the refractive index of the fibre so in practice we end up with around 10 radians of phase change for each micron of strain. A similar calculation can be done for temperature sensitivity, here we typically get around 1000 radians of phase change for each degree change in temperature (depending on the cable construction and the gauge length). Typical sensitivities of phase measurement are around 0.001 radians (when averaged over a second), so the origin of the extreme sensitivity to change becomes clear.

A quantitative system has a similar sensitivity to a qualitative system (when not faded), but since the changes in phase are tracked, temperature and strain changes can be observed and understood. We can now quantify changes in temperature of the cable, or measure the effect of strain on the fatigue life. Another advantage of tracking phase rather than amplitude is that the distortion of signals is vastly reduced, as discussed above. This creates measurement problems and is best avoided. For example, we may be interested in looking for a 300 Hz grounding signal and need to be sure that the 300 Hz signal that is observed is real, not just a measurement artefact.

Quantitative systems have also had the benefit of much development in recent years, pushing the maximum range to further than possible with older qualitative machines (without compromising spatial resolution) and also reducing the problems of fading. However, as discussed, they are more expensive, and less amenable to reduction in size and cost. However, the absolute nature of the output enables a much greater array of use cases and they remain the recommended route for most applications.
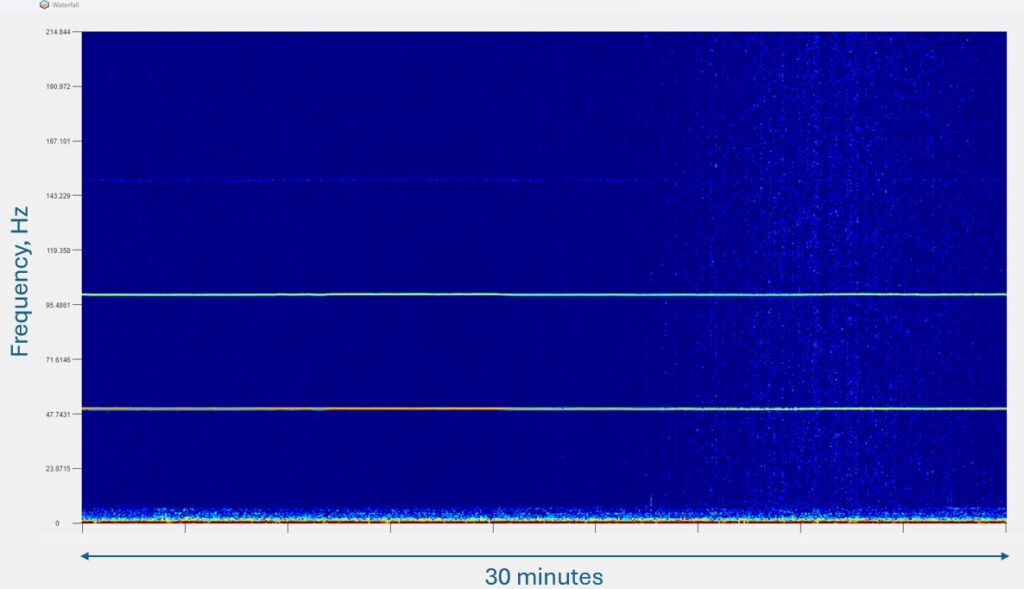
Single channel spectrogram from SAME location with Quantitative unit

This figure shows a spectrogram from the same section of export cable shown the figure above, but this time taken using a phase coherent DAS. The 150 Hz harmonic is very faint, and in this case real. The low frequency noise from waves is seen at less than 1 Hz, as it should be.

Conclusions

In summary, qualitative units are best used as a cost effective solution for when specific detection of acoustic events is required – e.g. for locating a failure with a thumper or TDR.

For any sort of quantification or measurement of long-term changes, a quantitative device should be installed. We would always recommend the use of a quantitative device to our clients for permament monitoring systems, but we are often asked to look at data from older qualitative units and these can still deliver value but insight must be taken with an understanding of the inaccuracies of the data.

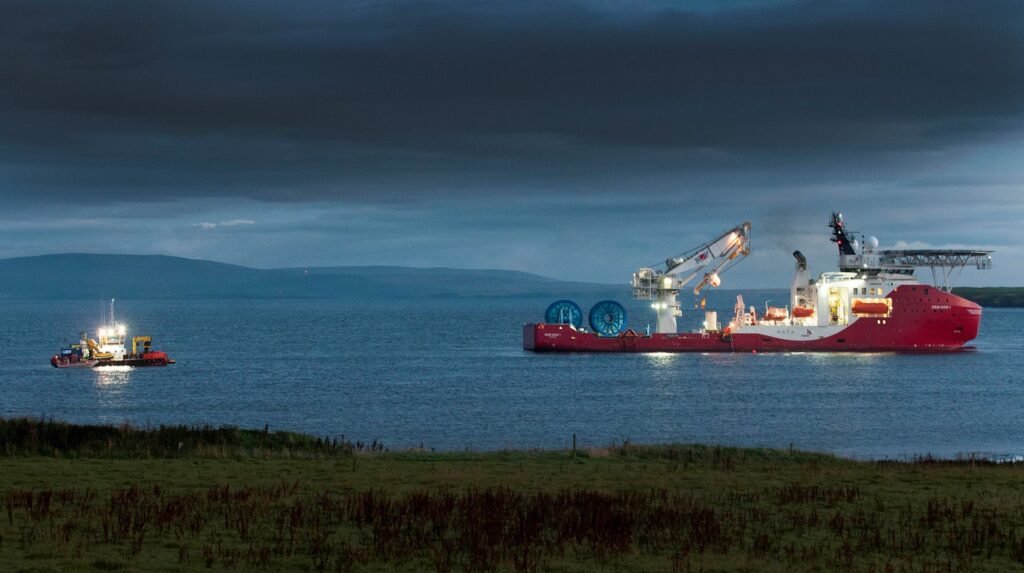
Indeximate commences cloud cable condition monitoring with MeyGen

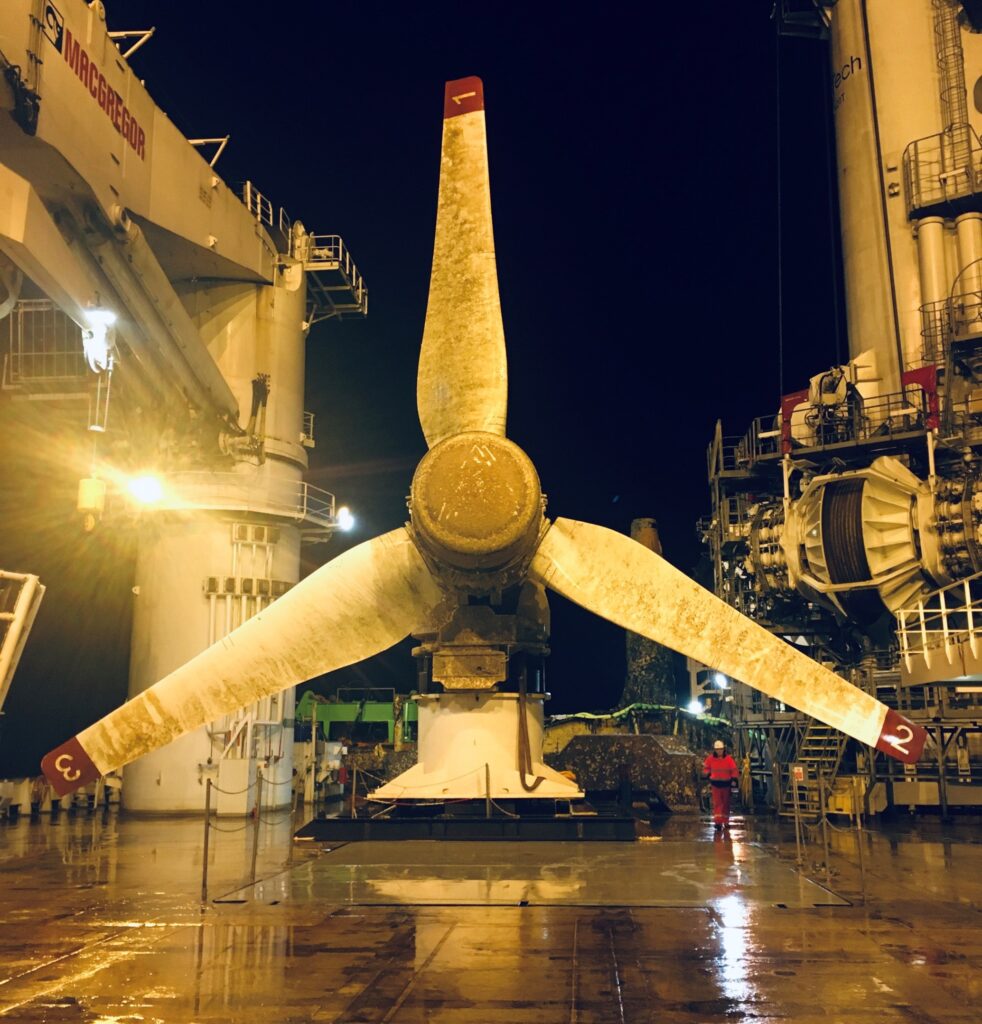
Indeximate Ltd, announces the start of cloud-based cable condition monitoring with SAE Renewables MeyGen tidal-stream energy plant in Caithness, Scotland.  The contract covers an annual subscription to Indeximate’s Scattersphere for cable and environment condition monitoring across all of MeyGen’s four turbines which in addition incorporates the storage of all of MeyGen’s DAS data throughout the monitoring period.

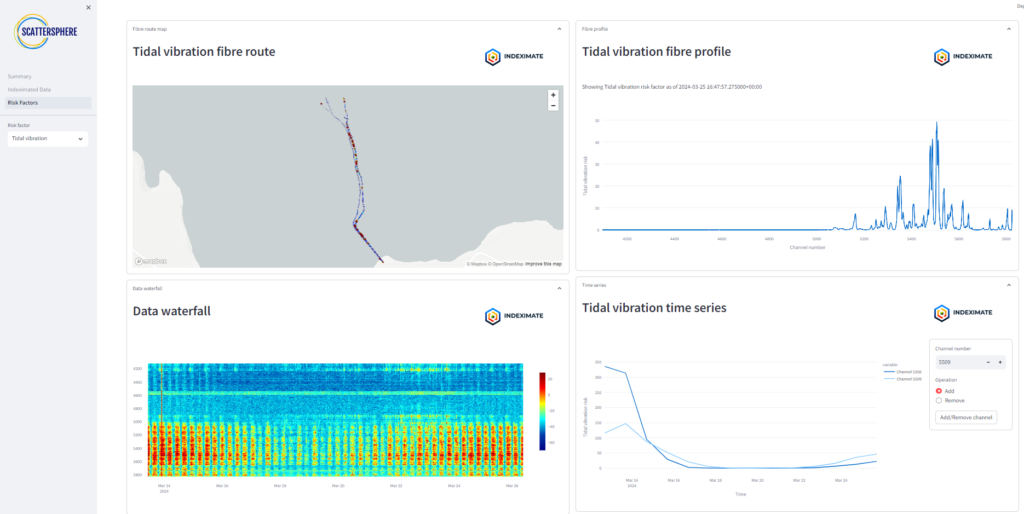
The permanent condition monitoring project builds on MeyGen’s commitment to the understanding of cable condition and exploits their existing ASN OptoDAS monitoring.  Indeximate adds to this the long-term trending of cable condition established from the raw DAS data stream which will profile the risk of fatigue, armour degradation, abrasion, vibration and free span condition.  

The cable conditions at MeyGen are quite unique featuring unburied quad armoured cable on an exposed seabed in one of the highest energy tidal streams on the planet.  Prior analysis of a single month’s data by Indeximate has suggested that the presence of the multiple layers of armour are successfully preventing fatigue.  Continued analysis of the complete data record will allow this analysis to be extended to the full range of conditions experienced.

Risk profiles to cable from Indeximate Scattersphere
Indeximate Scattersphere risk profiles

In addition to the dashboard of condition data, Indeximate will be storing the complete annual DAS record of raw data in their cloud architecture – the Scattersphere.   The raw data is expected to sum to around 1 Petabyte of signal each year which presents significant challenges in storage and access – Indeximate address this via their proprietary Indeximation® process – a compression mechanism which supports cloud streaming of the data.

MeyGen

MeyGen is the operator of the worlds largest tidal array, located in the Inner Sound of the Pentland Firth between the Scottish mainland and the island of Stroma. With over 10 years of operating experience MeyGen is a world leading organisation in the production of renewable electricity from tidal stream.

Having generated over 62GWh of electricity and achieving year on year system availability in excess 95% from tidal turbines generating 1.5MW, MeyGen have continually sought to increase system efficiency and reduce operating costs in their commitment to demonstrate the commercial opportunity the tidal industry presents to the UK.

MeyGen have exploited their operational knowledge and position as industry leaders to develop the asset management strategies needed to reduce the Levelised Cost of Energy of this source of predictable renewable electricity.

With array subsea export cables deployed directly onto the exposed bedrock present in high flow tidal environments where these machines are installed, MeyGen has worked with Alcatel Submarine Networks to monitor the subsea assets using Distributed Acoustic Sensing. Utilising this system MeyGen have contracted Indeximate to provide continual monitoring of this exposed asset to provide early warning of concerns in the integrity of this crucial asset.

Fraser Johnson, Operations & Maintenance Manager for MeyGen PLC

The award of a support contract to Indeximate to utilise our DAS system supplied by Alcatel Submarine Networks and provide continual monitoring of the subsea cables will have a considerable impact in reducing our OPEX costs. We are aware that the cables have some movement due to the tidal flow, the support of Indeximate will enable us to identify the location and quantify that movement. Operating an informed asset management strategy MeyGen will where necessary intervene to avert cable damage and loss of generation. We see this capability as an intrinsic element of our operating strategy, reducing the exposure of our insurance under writer may otherwise be exposed to. Working with the insurance market MeyGen will seek to utilise the knowledge provided by Indeximate within the scope of an informed asset management strategy to focus our planned maintenance activities while reducing our insurance premiums.”

Paul Clarkson, Director for Indeximate Ltd

“This contract marks a key step in our development, opening for the first-time permanent condition monitoring with trending of risks to cable health which builds on our success in delivering discrete cable health checks. Storing a year’s DAS data in the cloud will additionally open new opportunities for understanding change in the local environment over an extended time period”

Dan Danskin, Commercial Manager, Alcatel Submarine Networks

“The ability to analyse and store a years of OptoDAS data will enable Meygen to further improve upon the exceptional range and sensitivity capabilities of the ASN OptoDAS Frequency Swept Interrogation (FSI) solution.  We are looking forward to future collaborations with Indeximate on power cable monitoring projects.”

Alcatel Submarine Networks, part of Nokia, leads the industry in terms of transmission capacity and installed base with more than 750,000 km of optical submarine systems deployed worldwide, enough to circumnavigate the globe almost 19 times. From traditional telecom applications to content and “over the top” service provider infrastructures, as well as to offshore oil and gas applications, ASN provides all elements of turnkey global undersea transmission systems, tailored to individual customer’s needs. An extensive services portfolio completes its comprehensive offering for the submarine business, including project management, installation and commissioning, along with marine and maintenance operations performed by ASN’s wholly owned fleet of cable ships.

Simon Cheeseman, Sector Lead, Wave & Tidal Energy, ORE Catapult 

A better understanding of cable prognosis and failure modes to minimise downtime will be essential in reducing project OPEX costs while maximising energy generation in tidal stream projects. In our recently published Tidal Stream Technology Roadmap report, we estimated that effective condition monitoring of subsea cables could reduce the levelised cost of energy in tidal energy projects by 2-5%. We are delighted that the TIGER project has been able to support MeyGen in demonstrating the capabilities of subsea cable condition monitoring for the tidal sector.”

Why Monitor Cables Anyway?

Surely that’s obvious? To prevent failure and save the crippling expense of a repair? Well that’s true, but it’s nowhere near all of the value.

Clearly, not having to spend £20m on a repair and wait 6 months to do it is a good thing… But the savings don’t stop there and it’s not JUST a risk play. The act of monitoring your cables can do much more for your cost position:

  • Improve your insurance position – most insurers are pro monitoring (and if your’s isn’t take our certificates to a broker who will make sure they are) and commitment to both health check monitoring and continuous monitoring will improve your insurance position – it has the ability to reduce your deductible, improve your coverage and also your premium. Put simply, it allows insurance to return to being a transfer of risk of unpredictible events – i.e. the predictible is now managed and dealt with by preventative maintenance.
  • Reduce your survey costs – you know the drill – running up and down the cable in a linear manner, once every few years, in an windfarm covering 1/4 of your footprint every year. It’s informative but inefficient. Cable monitoring allows you to run shorter more targeted surveys each year covering the whole windfarm by knowing where to look

Sticking with the money theme, it also has the potentil to overall improve your asset value. Considering the end of licence or the handover period to a TSO/OFTO. A robust cable survey can take previously unanswerable questions off the table and improve the book value of the asset. Knowing your cable is in great condition is a tremendous comfort blanket to a new owner. The presence of condition monitoring and a history of Indeximated data can future proof your monitoring requirements (when a new analysis arises it can immediately be applied to years of historic data), can lead to research opportunity with 3rd parties for forensic analysis and the data itself has a value that can be liberated – so let’s talk about new revenue streams.

Unique to the Indeximate approach is that we port your DAS data to the cloud (“what, no, it can’t be done ” etc etc). We hear this time and time again that the main blocker to exploiting fibre sensing – well we don’t accept that. We will store a year or more of data and what’s more we’ll enjoy doing it. Cable change mechanisms take place over long periods of time so you NEED to be able to store and handle long data streams. Our Indeximation approach does exactly this – it creates an interrogable indefintiely long data series in the cloud. Once there we can create alternative information products for 3rd parties – think of wave height data for operations for example. There’s a long list of potential applications and these have a value that can be realised. Work with Indeximate to liberate this value and earn a return from your condition monitoring!

Sticking with that topic of wave height – this and other data has a huge benefit to allowing you to optimise your operations. You are considering an intervention and are relying on METOC data to understand wave height conditions -instead of gross averages we can liberate the wave height at all points along your cable (which means around your windfarm) at all times with pinpoint precision. This and other seabed data & environmental data allows you to optimise your operations.

Finally, environmental impact is not talked about enough. Our industry addresses it carefully in planning stages and there will be some monitoring through life. But hold on, we are collecting a wealth of data about the interaction of the cable with the environment and most of it gets thrown away! This is crazy – in the interest of digital twinning and more complete profiling,cable condition monitoring becomes our key sensor in the middle of the environment we are working in – let’s use it. Knowledge of cable seabed interaction over time? Seabed temperature change? Cetacean monitoring? Benthic profiling? All are possible direct products or researhc products that can be delivered. Again let’s go back to Indeximation – we’ve created a massive store of data about your windfarm or cable – this can be put to work for environmental monitoring purposes with research insitutions or in-house operations.

So there is a wealth of potential uses – monitoring is not JUST about cable condition and failure prevention although clearly that’s the main motiviation. Let’s expand the conversation from there and explore what else can be achieved. Listen to what your cables are telling you!

Subsea Cables & Insurance – We need a conversation on a new direction

In our short existence one thing has become clear: the fragility of the relationship between regulators, insurers and the insured.  The imperfectly operating power cable O&M market is creating a trajectory that is in danger of heading into troubling waters.   We feel a deep dive into these issues was worthy of an extended post into a blog article.

In the UK like other markets, the workings are intended to be simple:  The export infrastructure (offshore substation to onshore substation plus export cable – an OFTO here in the UK – Offshore Transmission Owner, TSO in Europe – Transmission System Operators) is owned and operated by a different body from the windfarm operator or developer.  Once operating the transmission assets are sold to a separate body with warranties from the developer and assurances from the state.

This allows the grid connection to be controlled and creates a break between demand and supply to effect some regulation of the marketplace and avoid any of the three parties being held to ransom. OFTO’s take insurance from the market and OFGEM (in the UK) regulates the activities with the ability to provide cover in the situation where insurance is difficult or losses ungovernable.  The nation is committed to offshore wind as part of our legally binding net zero targets and if systemic or other issues cause a failure in this fragile arrangement the buck will stop with the consumer via higher electricity prices.

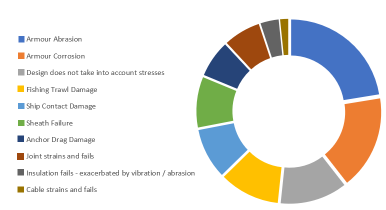
Export Cables are known to be a big issue in this mix.  We know that around 80% of insurance claims are caused by cables – this comes from a mixture of legacy design issues, deployment issues, environmental issues and those originating from human activity.  It’s also often incorrectly stated that the majority of failures are down to human activity. A growing body of literature is probing the root causes of failure with solid evidence developing within academia and independent bodies such as ORE Catapult and CIGRE that show this is not the case.   

The true picture of failures is a veritable mix of sources from human error, design error, deployment error magnified or augmented by the action of the environment.  Many of these overlap and for example a minor issue unnoticed in production or deployment will be exacerbated if the environment becomes dynamic.  Additionally, the early pioneers of wind have suffered badly with some design flaws coming to light years later and prove an expensive headache for all concerned.

The role of insurance

Today in 2023 as a result, it’s commonly stated that insurers have not had sufficient “non claimers” to fund the “claimers” in their portfolio with many considering their efforts “loss making”. Why is this?

Well, the opaque nature of the sea lies at the heart of this.  The OFTO or operator has very few tools at their disposal to understand the condition of their cables and the nature of their interaction with the environment.  This leads to the depressingly common situation where all cable failures become an insurance claim.  

Well surely that’s reasonable and that’s the point of insurance? Is the market not just trying to operate at too low a cost?    Well let’s visit that – the purpose of insurance is to transfer unpredictable risk from the asset owner and put it in the hands of a bulk owner who assesses the risk and prices accordingly.   It works well on unpredictable cases.   In our current world if you have no knowledge, ANY failure is unpredictable and therefore ALL failures are indeed an insurance case.   

Owners are both encouraged and obliged to check their cables – and this will typically take the form of an occasional and expensive survey to either measure the height of the seabed by towed or hull mount sonar or carry out a slow, step by step video survey by tone-locking ROV to confirm cover and exposure.  Again, the key risk being considered here is exposure and propensity to damage from human activity.

Although imperfect and occasional this is fine – but it omits a huge class of potential failures and degradations that are invisible – such as abrasion of armour, fatigue in sheathing, erosion of FO tube and defects either from manufacturing or from cable deployment.  In this case now where gradual degradation suddenly expresses itself as failure, the OFTO legitimately states “we knew nothing about it”, the insurer ends up paying out albeit often with a high deductible.   Policy prices spiral and deductibles inflate. 

To make matters worse if a technology arrives to put a spotlight on the cable’s condition – it may perversely be considered a penalty to install it – after all if a technology points out flaws that may not become failure they immediately break the rule of “unpredictable” so guess what – degrading cables are excluded and the operators may be left in a perceived “worse” state.  As well as increasing premiums and deductibles, we also have the reality of decreasing cover. Of course the situation where erroenous identification of deterioration needs to be guarded against by proper technology validation and verification which is where our industry body stakeholders need to step in.

We’ll return to this, but first let’s consider the actions of our regulator OFGEM.   OFGEM are essentially becoming the insurer of last resort – and they are unhappy with that position.  By licence OFTO’s are not directly encouraged to investigate new technologies and essentially have to use proven technology to change their maintenance regime – i.e. the maintenance pot is fixed and if they wish to move money into a new basket it has to come out of the fixed pot.    Worse still – where an unpredictable failure that insurance will not cover the bill comes back to the public as an IAE (Incoming Adjusting Event) hitting our future bills. In their most recent case the language is very negative – it’s not a place they want to be – referring to “reasonably foreseeable” failure but at the same time the “unavailabity of insurance” and crucially “the Licensee did not have the opportunity to manage the risk” – so what about a better future where they do?

So what needs to change? 

Fibre Optic sensing technologies exist that can carry out location by location integrity assessment – a fibre that is ALREADY in the cable can provide information on temperature, strain, vibration, fatigue, exposure state, electrical response and more – we call these Distributed Fibre Optic Sensing (DFOS).  

Those with decaying cables or troublesome conditions can immediately take the benefit of condition monitoring in a palliative care scenario where for example live or regular monitoring of cable performance creates a feedback loop to either limit conditions or influence pre-emptive repair.  But this is solely the domain of the “uninsurable”.  Surely the market could do better.

Instead of technology coming to the defence of the poor few with the “uninsurable conditions” the insurance industry could advocate knowing better the condition of cables to all – by decreasing deductibles, increasing the level of cover or best still decreasing premiums.

This can easily be tied to the level of knowledge of the cable – a commitment to monitoring should increase the knowledge of the cable and should decrease the risk – insurers can price against risk and be able to act more competitively.

Regulators can operate knowing that cable condition can be more closely considered and could use the Innovation tools in the licence to encourage this approach rather than rigorously hold OFTO’s to approaches deemed correct at the time of licence.   Permanent monitoring can be held more effective than occasional health checks – but both have value. OFGEM could encourage more innovation in transmission licence by including non-pricing measures in their calculations and nudge licencees towards new technology exploitation rather than swapping slices of a small pie.

In this future integrity specialists become not the pariahs of ambulance chasing but become oarsman guiding the asset owners to a stable future.

So who would be the winners? 

  • Insurers can account for risk with greater granularity and precision – and price more competitively – more knowledge = lower risk.
  • Asset owners can sit more comfortably with greater knowledge of the condition of their portfolio – it also needn’t be a cost burden as more targeted knowledge can make inspection more regular and more precise.  Rather than laboriously cover each metre of cable every few years, target the suspect locations every year – more quickly and more effectively.
  • Regulators can continue to be backstop but with a significantly reduced exposure
  • The O&M Community has greater depth to offer to the industry

And what needs done to create this Utopia?

Requirements for condition monitoring should be curated by an independent industry body – they aren’t a standard of “how” to carry out such work but rather they are a set of guidelines or requirements for the type and quality of output.  More detailed information should leverage better insurance conditions.

At Indeximate we don’t intend to lob in problems without solutions – watch out for our next publication which will illustrate the next step forwards this with a free to adapt, creative commons licence set of requirements.   We want to work with ALL stakeholders to move condition monitoring forwards.